My First Markdown Document
Emily Ressler
1/16/2018
Target Graph

Target Graph
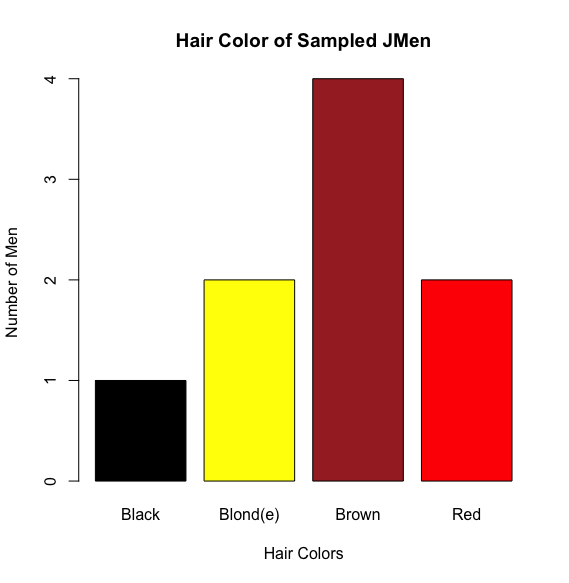
My goal was to reproduce the graph in Part A in an R Markdown file.
Data Entry
Data
jmen <- read.table("jmen.txt", header=TRUE)Imitation Graph
Graph
#barplot of hair color
hair_table <- table(jmen$Hair)
barplot(hair_table, col=c("Black", "Yellow", "Brown", "Red"), main="Hair Color of Sampled JMen", xlab="Hair Colors", ylab="Number of Men", names.arg=c("Black","Blond(e)","Brown","Red"))
This graph is identical to the Target Graph, except for differences in dimensions (due to how I saved the Target Graph when saving it as an image).